
Tutorials and Getting Started
Find basic tutorials below for getting started with MarketGod on Tradingview
100K+
Trades made using our indicator
10K+
Active users worldwide

v10
Current Indicator Version
∞
Hours spent building and refining this tool


Adding Alerts
1. Navigate to the timeframe you trade and the market of choice.
2. Right click the chart, and click add alert.
3. Change the source of the alert to theMarketGod Indicator (not the strategy).
Tradingview has resources available to determine which alert settings are best for your situation.

Indicator Library Tutorials
Finding MarketGod
1. From the homepage, click on 'Chart' in the top navigation bar.
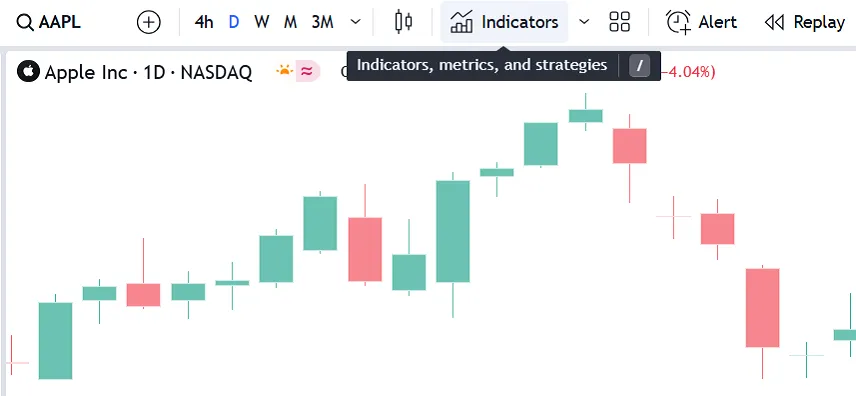
2. Select "Indicators" on the top-center-middle panel.
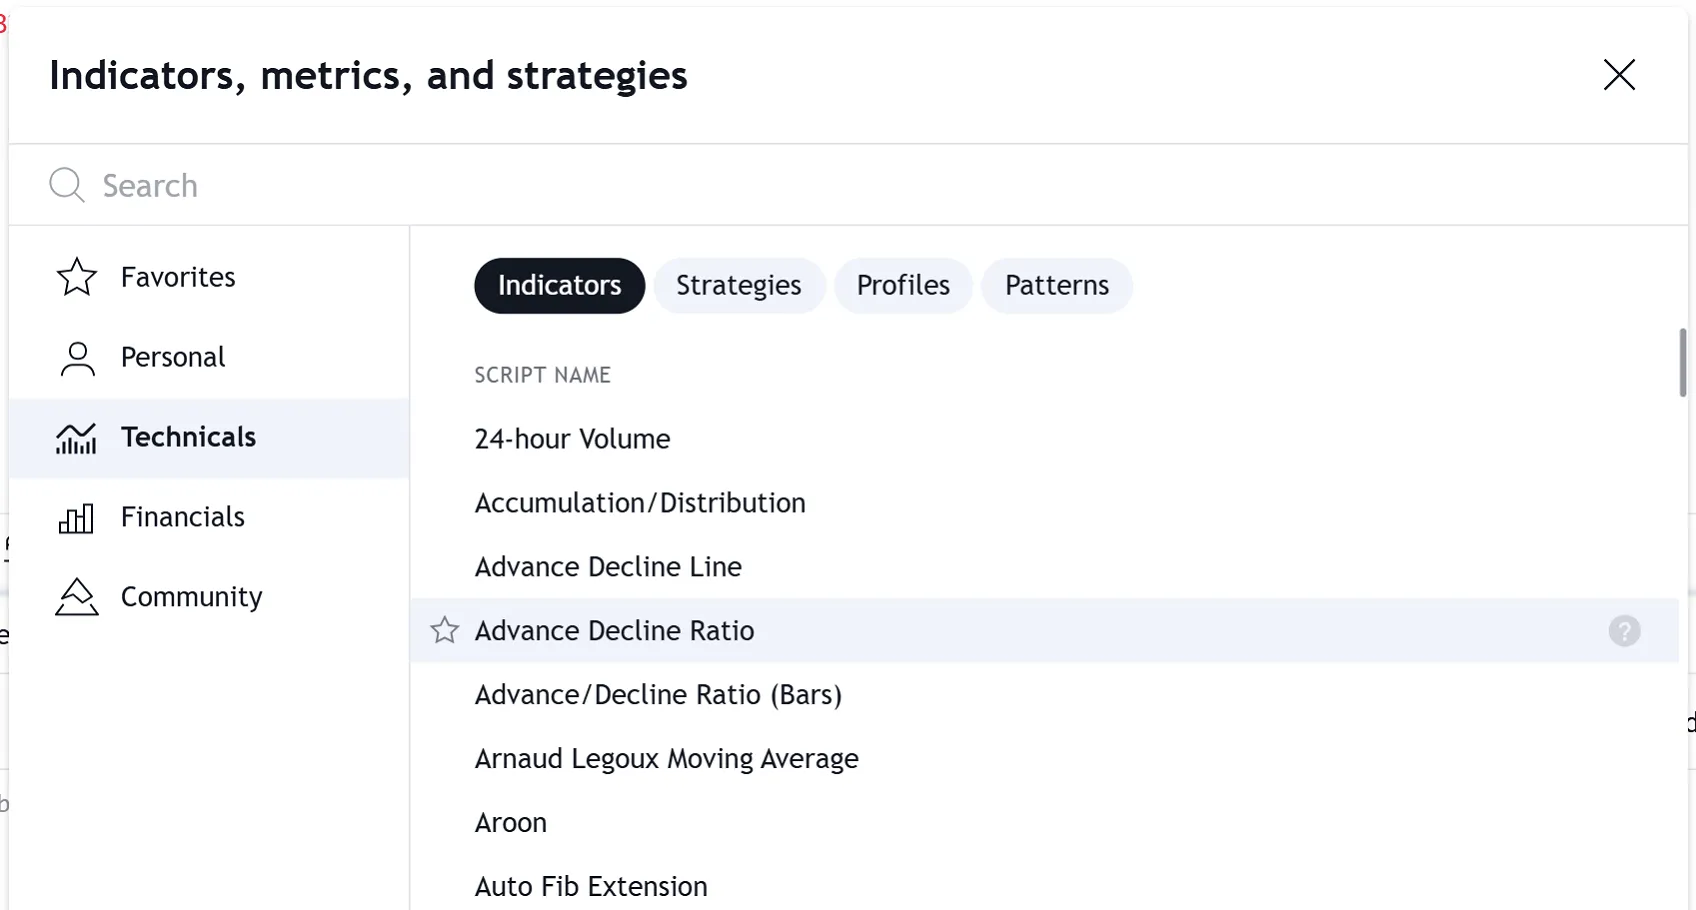
3. In the indicator library, you will see your Tradingview account shows an "invite only" section on the left-and side.
4. The indicator and strategy will both be available to you.

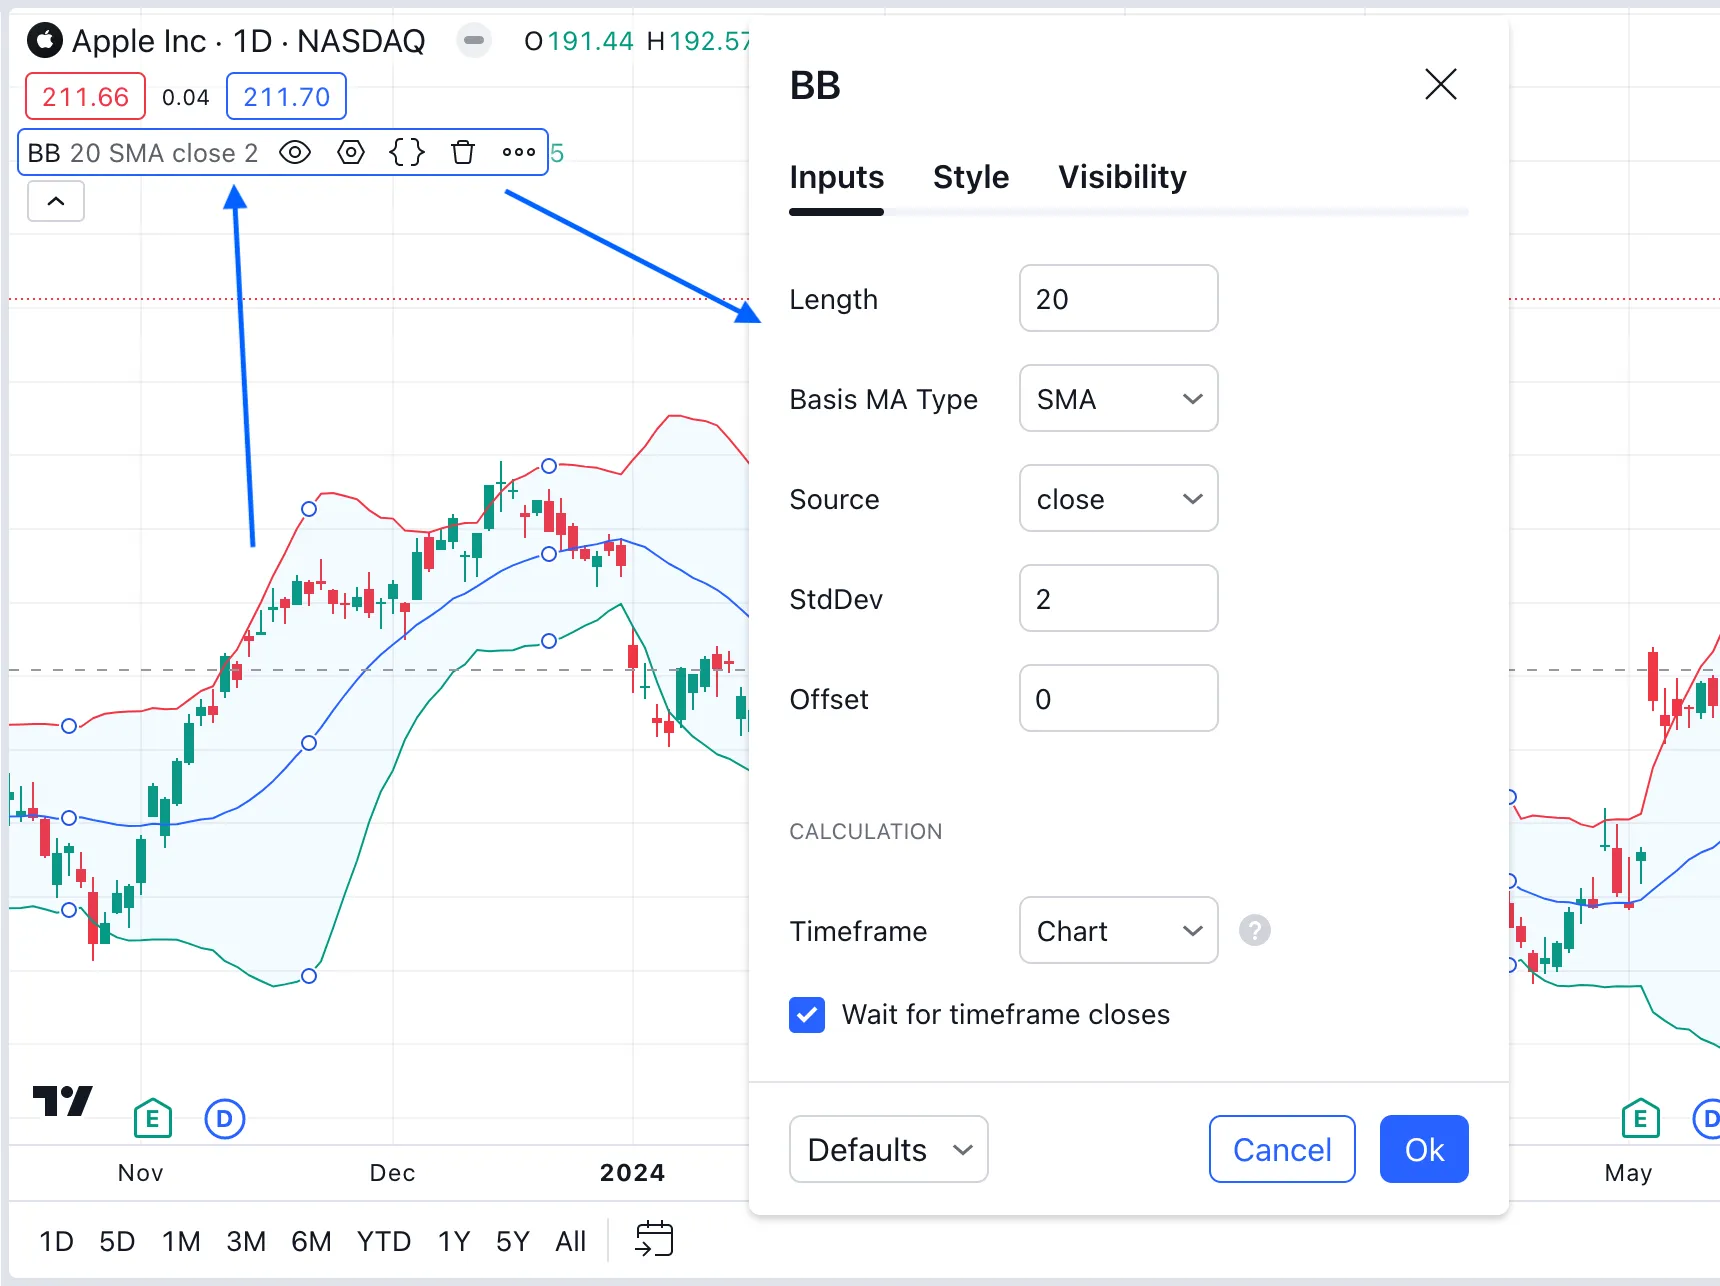
Adjusting MarketGod Settings
Navigate to the settings tab by double clicking the indicator name in the top left corner of your chart.

What is Tradingview, and how do I get started with it?
Tradingview is a powerful web-based platform that offers advanced charting tools, real-time market data, and a vibrant community for traders and investors. To get started, simply visit the Tradingview website and sign up for a free account. Once you’re in, take a tour of the interface, familiarize yourself with the charting tools, and explore the wide range of indicators available. The platform is user-friendly, so you'll be able to customize charts and begin analyzing the markets in no time.
What are indicators, and why are they important in trading?
Indicators are mathematical calculations based on the price, volume, or open interest of a security. They help traders identify trends, reversals, and market momentum. In trading, indicators provide crucial insights that can inform your decisions, whether it's confirming a buy or sell signal or providing a clearer view of market conditions. Using indicators can also help you develop and backtest trading strategies, enhancing your chances of success in the market.
How do I add indicators to my TradingView chart?
Adding indicators in Tradingview is straightforward. Once you have your chart open, navigate to the top toolbar and click on the "Indicators" button. You'll see a menu with various categories like Technical Indicators and Community Scripts. Just search for the indicator you want to use, click on it, and it will automatically apply to your chart. You can further customize settings by clicking on the indicator’s name in the chart’s pane.
How can I use indicators effectively in my trading strategy?
To use indicators effectively, it's essential to combine them with your overall trading strategy rather than relying on them solely. First, find indicators that align with your trading style.
Some traders prefer trend-following indicators, while others may favor oscillators. It's also important to avoid "indicator overload;" using too many can create confusion. Focus on a couple that you understand well, then backtest your strategies to see how they perform in historical data.
Always remember to consider market conditions and use risk management principles alongside your indicators.
What is repainting? Does MarketGod repaint?
Repainting is defined as script behavior causing historical vs realtime calculations or plots to behave differently. MarketGod does NOT repaint.
Trade with MarketGod
Supercharge your trading strategy with MarketGod Buy and Sell Alerts for Tradingview
